Public Health
What does a healthy New York City look like?
In a perfect world, a healthy city would be one in which all residents have equal access to basic necessities like fresh food, open space, and public transit options. It would be one in which no person goes unhoused, and residents have access to housing that is affordable and in a state of good repair. It would be one in which the potentially devastating effects of climate change would be swiftly and seriously addressed, and residents would not have to worry about what the physical landscape will look like in 50 years. And it would be one in which public health is not determined by a person’s wealth, but is instead guaranteed for all.
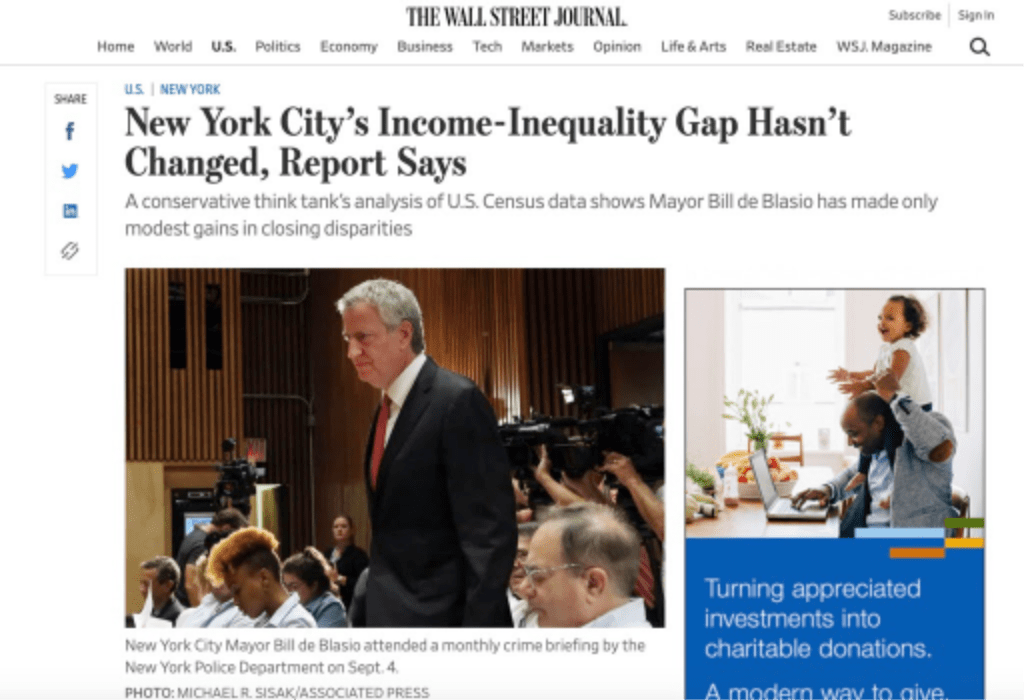
But we do not live in a perfect world, or a perfect city. Despite Mayor Bill de Blasio’s early campaign promises to end the “tale of two cities” and close the city’s income inequality gap, the economic disparity between New York’s wealthy and poor residents remains stubbornly high48. The negative consequences of this can be devastating; the homelessness crisis, lack of affordable housing, and poorly maintained public housing are all issues that primarily affect poor New Yorkers, and, within that subset, primarily people of color.
The coronavirus pandemic has exacerbated many of these issues. A virus that spreads when people are in close contact with one another has naturally ravaged public housing, where many are unable to self-isolate when they get sick. Thousands of New Yorkers whose economic circumstances have changed for the worse are at risk of losing their homes. And the city’s piecemeal approach to street planning has proved to be a problem as more New Yorkers seek open space in a time when we must remain physically distant from one another.
It’s unlikely that New Yorkers will be able to realize that idealized healthy city, thanks to a coronavirus-triggered recession and budget cuts that will impact city services for years to come. The coming 2021 municipal election presents a unique opportunity for residents to elect officials who they feel are best equipped to address these challenging times head on. The turnover in this election—of nearly the entire City Council, four borough presidents, comptroller, public advocate, and the mayor—is a once-in-a-lifetime opportunity, and one that will set the course of the city for years, and possibly decades, to come.
How Healthy Are NYC Neighborhoods?
This data visualization was created by the Civic Data Design Lab.
Few statistics show the stark difference in quality of life between wealthier and lower-income New Yorkers than life expectancy.
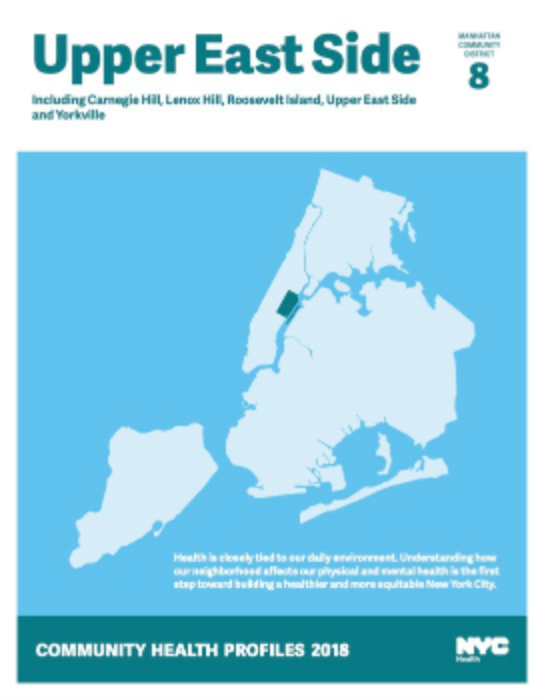
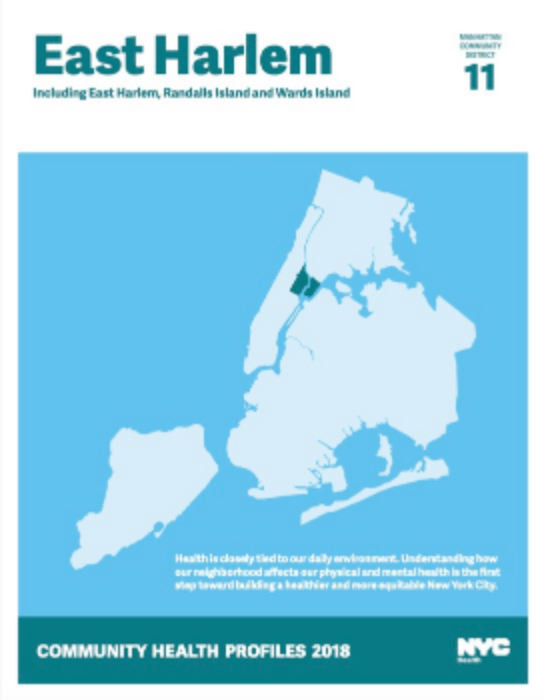
According to 2015 data from the NYC Department of Health and Mental Hygiene, the life expectancy of a person living on the Upper East Side49—one of New York’s richest enclaves—is 85 years. But for those living in East Harlem50, just north of the UES, life expectancy goes down to 76 years.
Differences in economic conditions, access to health care, and health outcomes account for these disparities, and that trend bears out in neighborhoods across the city.
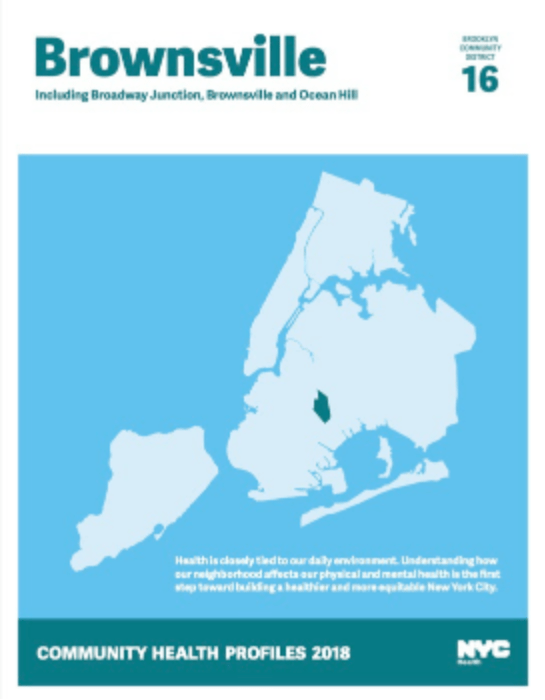
Brownsville, Brooklyn51, which has the lowest life expectancy at 74 years, has a higher poverty rate than the citywide average, a higher rate of hospitalizations caused by non-fatal assaults, twice the number of children who make asthma-related emergency room visits, and twice the rate of “avoidable hospitalizations”.
This visualization shows the effect that neighborhoods have on health by mapping out various factors that impact a person’s overall health—such as education level, income, employment, and housing situation—and showing where there are the biggest gaps.
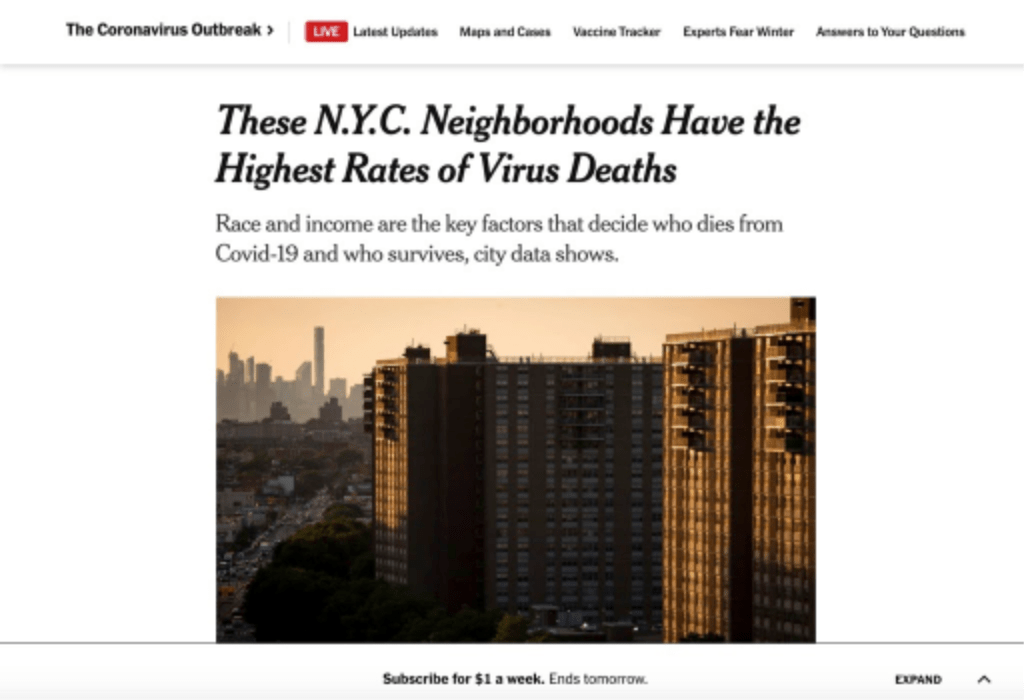
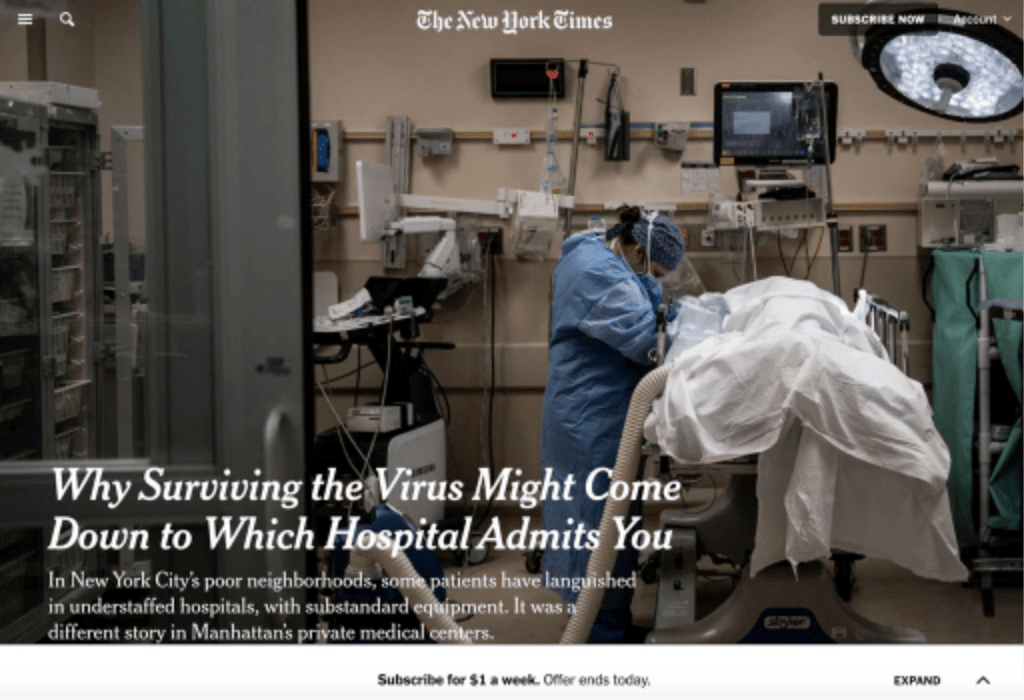
These disparities became even more apparent during the coronavirus crisis: study after study found that New Yorkers living in low-income areas, as well as Black and Latino New Yorkers, were more likely to contract and even die from COVID-1952. Many of the people in these neighborhoods are essential workers, do not have access to above-average hospitals or healthcare53, or are unable to isolate if they do become sick. Meanwhile, data from the city’s Health Department showed that wealthier neighborhoods in Manhattan (e.g. ones with a median household income above $100,000) were far less susceptible.
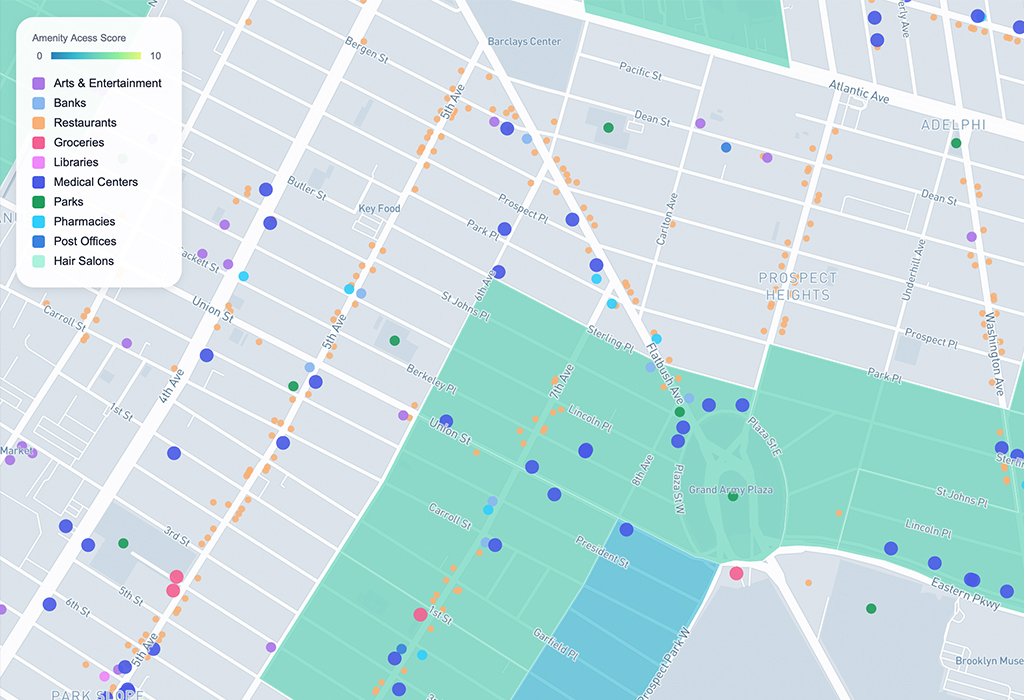 Visit Project Senior Amenity Access in New York City This student data visualization was created by Azury Lin, Barbara Alonso Cabrero, Tanvi Sharma at the Massachusetts Institute of Technology in the spring semester of 2020.
Simply put, the wealthier you are in New York City, the more likely you are to be in good health.
Accessing Amenities
In New York City, access to amenities, like grocery stores, parks, libraries, and public transit, is not created equal. While some parts of the city—typically wealthier neighborhoods or areas near central business districts—are rich in available options, many others lack easy, walkable access to the most basic goods and services.
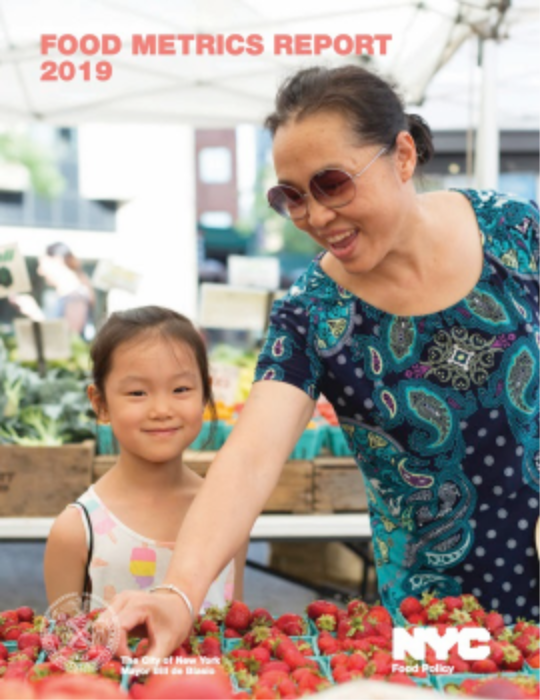
Take grocery stores: according to the city’s latest Food Metrics Report54, “many low-income areas continue to be underserved by full-scale grocery stores, due to high acquisition, development, and operating costs.” While various initiatives exist to help residents of low-income neighborhoods access fresh, healthy food—including subsidies that can be used at farmers markets and zoning incentives aimed at bringing supermarkets to those areas—gaps still exist.
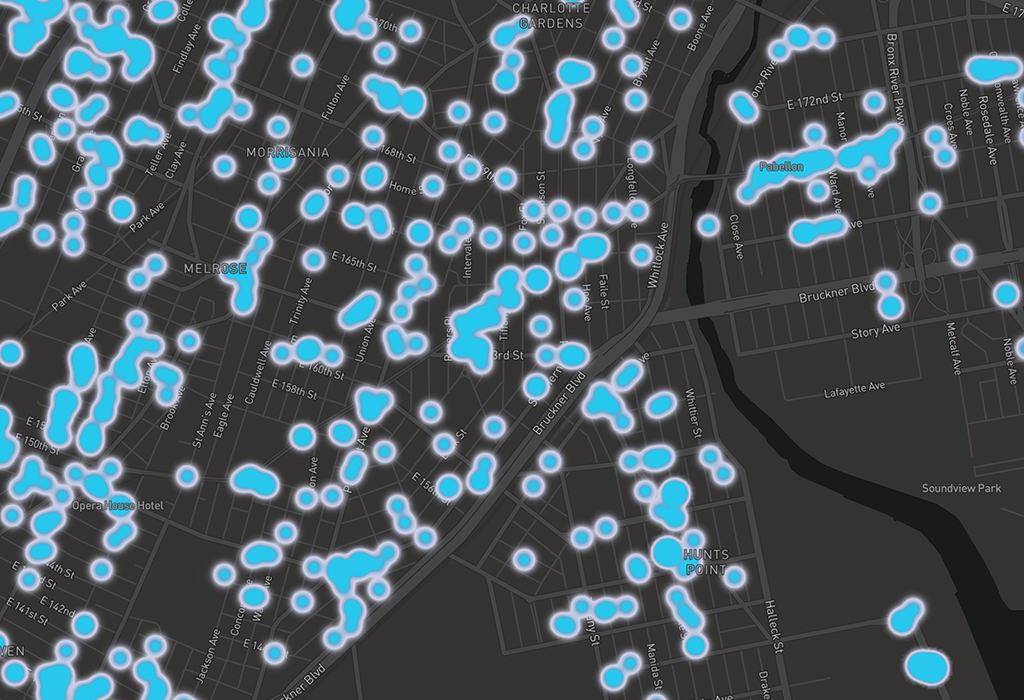 Visit Project South Bronx Healthy Food Locator This student data visualization was created by Esther Kim, Shi Tang at the Massachusetts Institute of Technology in the spring semester of 2020.
The South Bronx Healthy Food Locator, developed by CDDL students, illustrates how pervasive the problem is: the map shows all food stores within a radius of a quarter of a mile with a pop-up of detailed information, including the store type, store name, and health score.
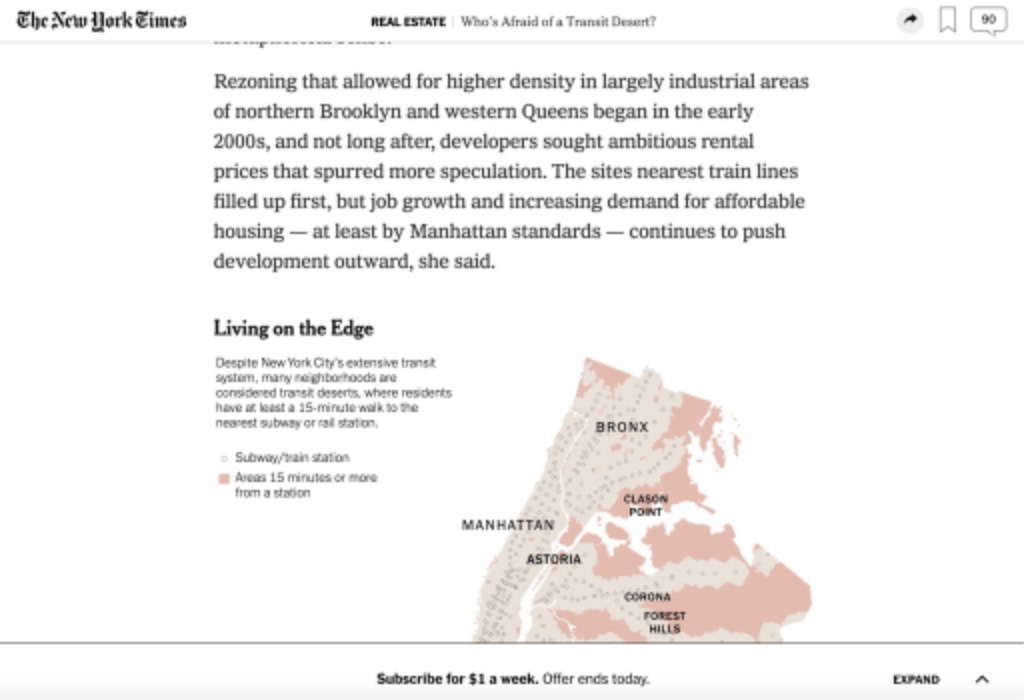
Equitable access to transit is also a problem: many New Yorkers, particularly those in the outermost reaches of the outer boroughs, live in transit deserts, where the closest subway or rail station is at least 15 minutes away55. This is especially problematic for elderly or disabled New Yorkers who rely on public transportation to move freely throughout the city.
These inequities aren’t limited to geographic areas; access is also a problem when you look at demographic statistics such as age or income level. The issue of access for the elderly is especially problematic considering that most people who would be considered “senior” would prefer to age in place rather than move to an assisted care facility. But for many older New Yorkers—particularly those in the outer boroughs—amenities like grocery stores are not within convenient walking distances, as shown on the Senior Amenity Access map, also developed by CDDL students.
References
48. New York City’s Income-Inequality Gap Hasn’t Changed, Report Says, The Wall Street Journal https://www.wsj.com/articles/new-york-citys-income-inequality-gap-hasnt-changed-report-says-11568174460
49. Upper East Side Community Health Profile, New York City Department of Health and Mental Hygiene https://www1.nyc.gov/assets/doh/downloads/pdf/data/2018chp-mn8.pdf
50. East Harlem Community Health Profile, New York City Department of Health and Mental Hygiene https://www1.nyc.gov/assets/doh/downloads/pdf/data/2018chp-mn11.pdf
51. Brownsville Community Health Profile, New York City Department of Health and Mental Hygiene https://www1.nyc.gov/assets/doh/downloads/pdf/data/2018chp-bk16.pdf
52. These N.Y.C. Neighborhoods Have the Highest Rates of Virus Deaths, The New York Times https://www.nytimes.com/2020/05/18/nyregion/coronavirus-deaths-nyc.html
53. Why Surviving the Virus Might Come Down to Which Hospital Admits You, The New York Times https://www.nytimes.com/2020/07/01/nyregion/Coronavirus-hospitals.html
54. 2019 Food Metrics Report, The Mayor's Office of Food Policy https://www1.nyc.gov/assets/foodpolicy/downloads/pdf/Food-Policy-Report-2019-Spread.pdf